How Many Sites Pass Core Web Vitals (CrUX / Field Data)?
- According to Chrome UX Report releases, only about 43–44% of origins (sites) currently pass the Core Web Vitals assessment, using real-world aggregated (CrUX) data (Chrome for Developers).
- Google also notes that over 40% of sites pass all CWV metrics—consistent with the 43–44% figure (Chromium Blog).
- Industry sources present similar findings:
- 32% of U.S. websites, 13% of desktop sites, and 12% of mobile sites pass CWV (Huckabuy).
- According to Ahrefs, only 33% pass on desktop, with even fewer on mobile (jetpage.co).
- Another estimate suggests 55% of websites fail the CWV assessment as of August 2023 (onilab.com).
Bottom line: It’s normal for most sites not to pass CWV—passing is still relatively rare (around 30–45%).
Lighthouse Score Averages (Lab Data)
Lighthouse scores vary based on the type of page (desktop vs. mobile) and site complexity:
- A benchmarking study of landing pages found median Lighthouse Performance scores around:
- 72 on desktop
- 37 on mobile (landingmetrics.com).
- On average, most developers aim for scores above 90, but a perfect 100 is extremely challenging, as incremental improvements from 90 to 94 equate to going from 99 to 100 in effort (Chrome for Developers, Duda Blog).
Summary Table
| Metric / Tool | Real-World Average / Common Range |
|---|---|
| CWV pass rate (CrUX data) | ~32–44% globally; even less for mobile / desktop separate |
| Lighthouse — Desktop | Median ~72 (landing pages) |
| Lighthouse — Mobile | Median ~37 (landing pages) |
| Lighthouse — High Score | 90–100 is excellent; 100 is rare to perfect |
Does PageSpeed Insights Track These Statistics?
- Yes, but indirectly—PageSpeed Insights shows both lab data (Lighthouse results) and real-world field data (from CrUX) (Marketing Aid, Google for Developers).
- Google does not publicly share global Lighthouse metrics, but CrUX averages—which feed into PSI’s field data—are accessible via tools like Search Console, the CrUX Dashboard, or BigQuery.
In Summary
Lighthouse scores vary based on the type of page (desktop vs. mobile) and site complexity:
- A benchmarking study of landing pages found median Lighthouse Performance scores around:
- 72 on desktop
- 37 on mobile (landingmetrics.com).
- On average, most developers aim for scores above 90, but a perfect 100 is extremely challenging, as incremental improvements from 90 to 94 equate to going from 99 to 100 in effort (Chrome for Developers, Duda Blog).
- Getting 100/100/100/100 on Lighthouse is exceptional, even though it’s still just lab data—not representative of real-world user experience.
- Only around 30–45% of websites currently meet good Core Web Vitals in practice.
- Typical Lighthouse scores hover around 70 on desktop and below 40 on mobile for landing pages.
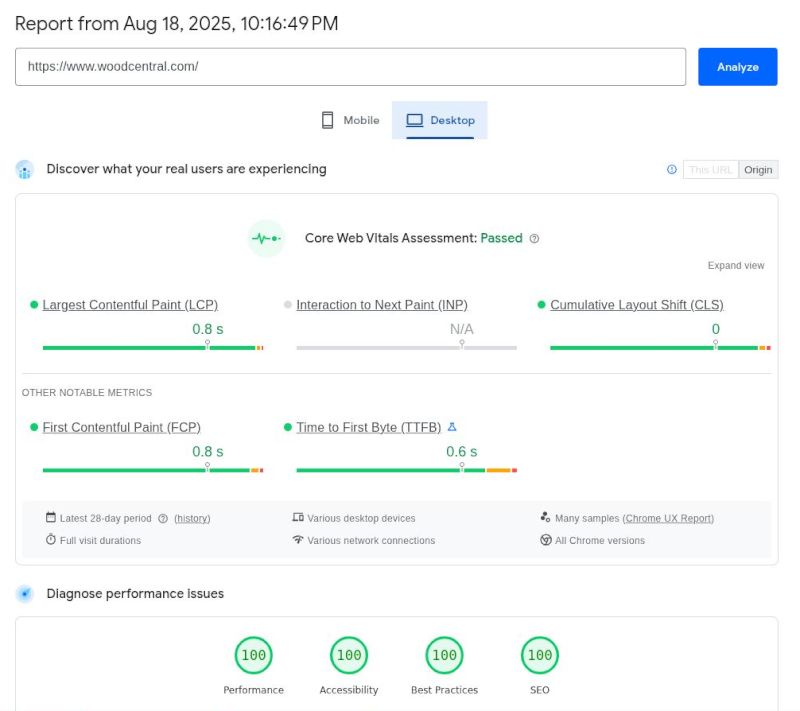
WoodCentral Lighthouse scores: